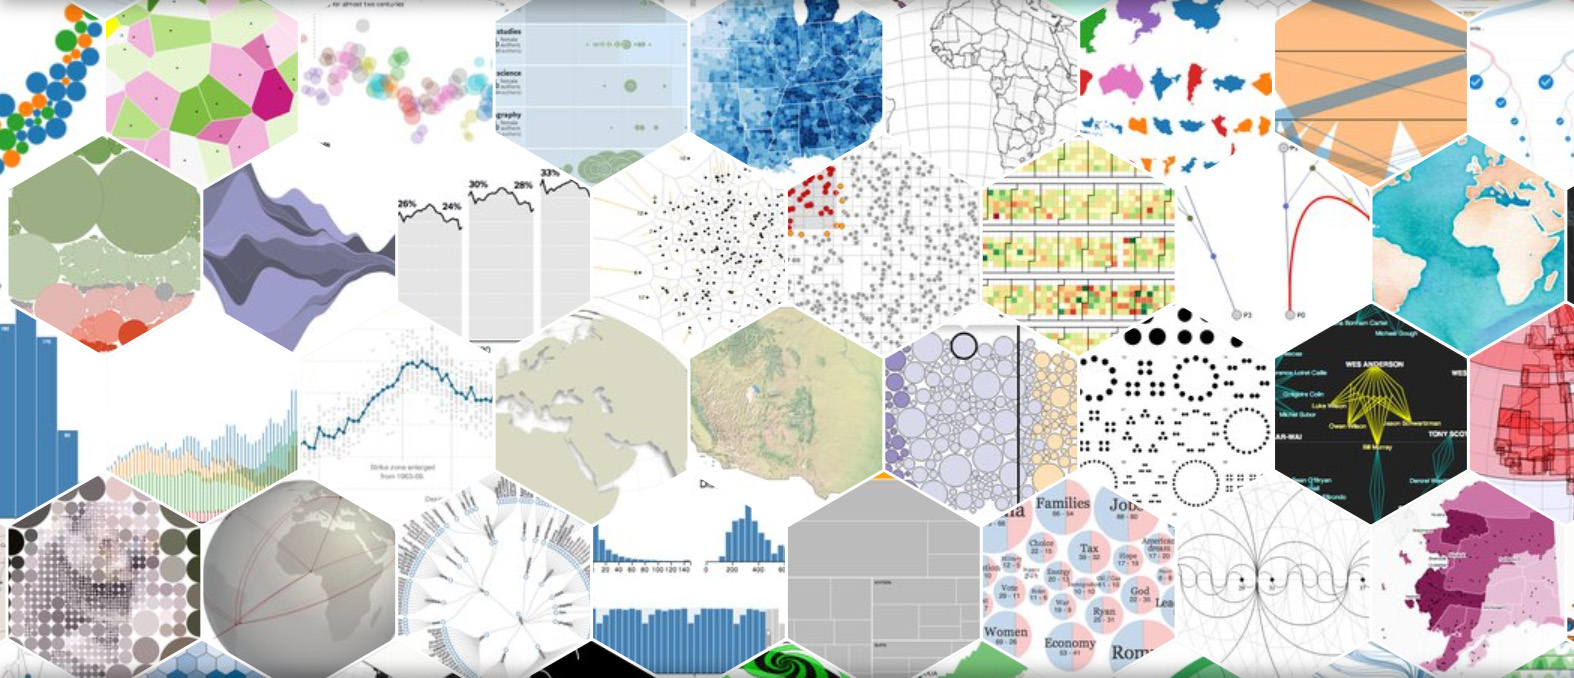
Visualization

Client-Server Architecture
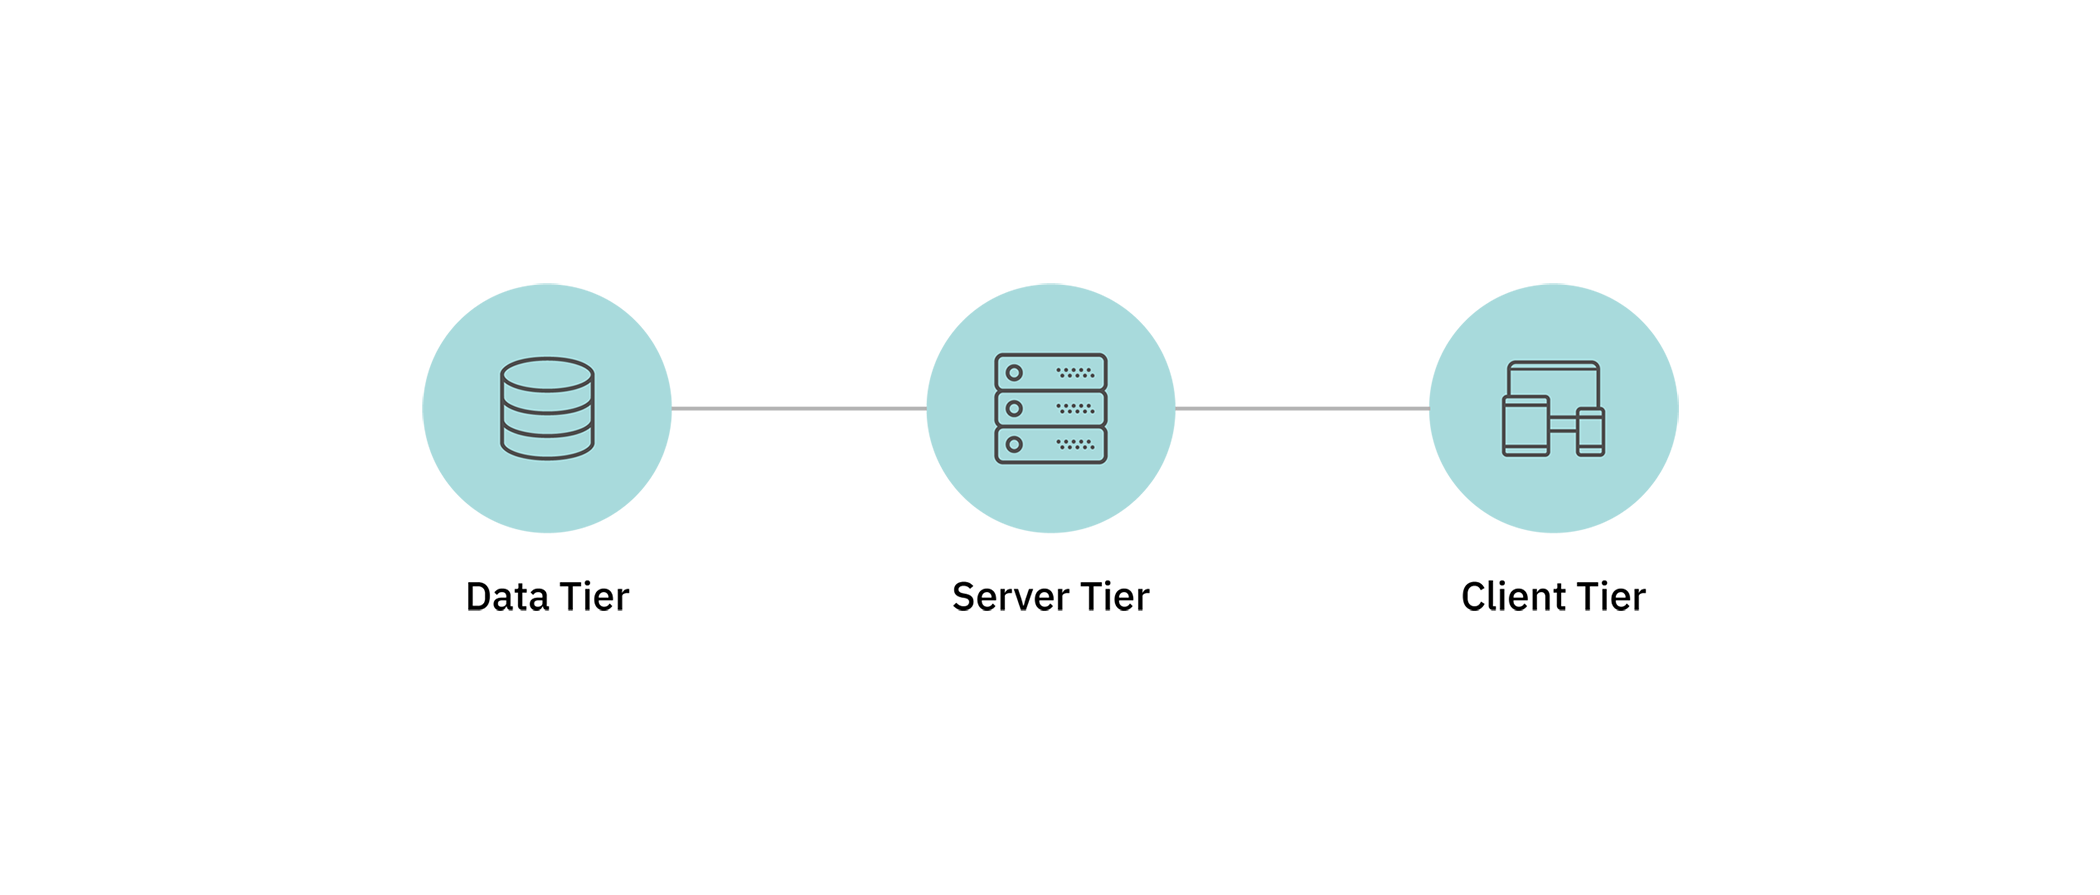 Image: Three-Tier Web Application Architecture.
The client–server model is a distributed application structure that partitions tasks or workloads between the providers of a resource or service, called servers, and service requesters, called clients. Read More
Source: "Distributed Application Architecture" (PDF). Sun Microsystem.
JavaScript
Server Side
Node.js is a server side JavaScript framework that is event-driven and allows non-blocking I/O operations. Node Package Modules is the most popular ecosystem of open source libraries out there. The convenience of using JavaScript in Node.js backend, and for client-side front end makes it a very attractive option for developers to build applications with.
Turf.js is geospatial analysis library that can run in browser and also Node.js. It is built modularly where each module can work as a standalone function. Turf.js works well with GeoJSON notation.
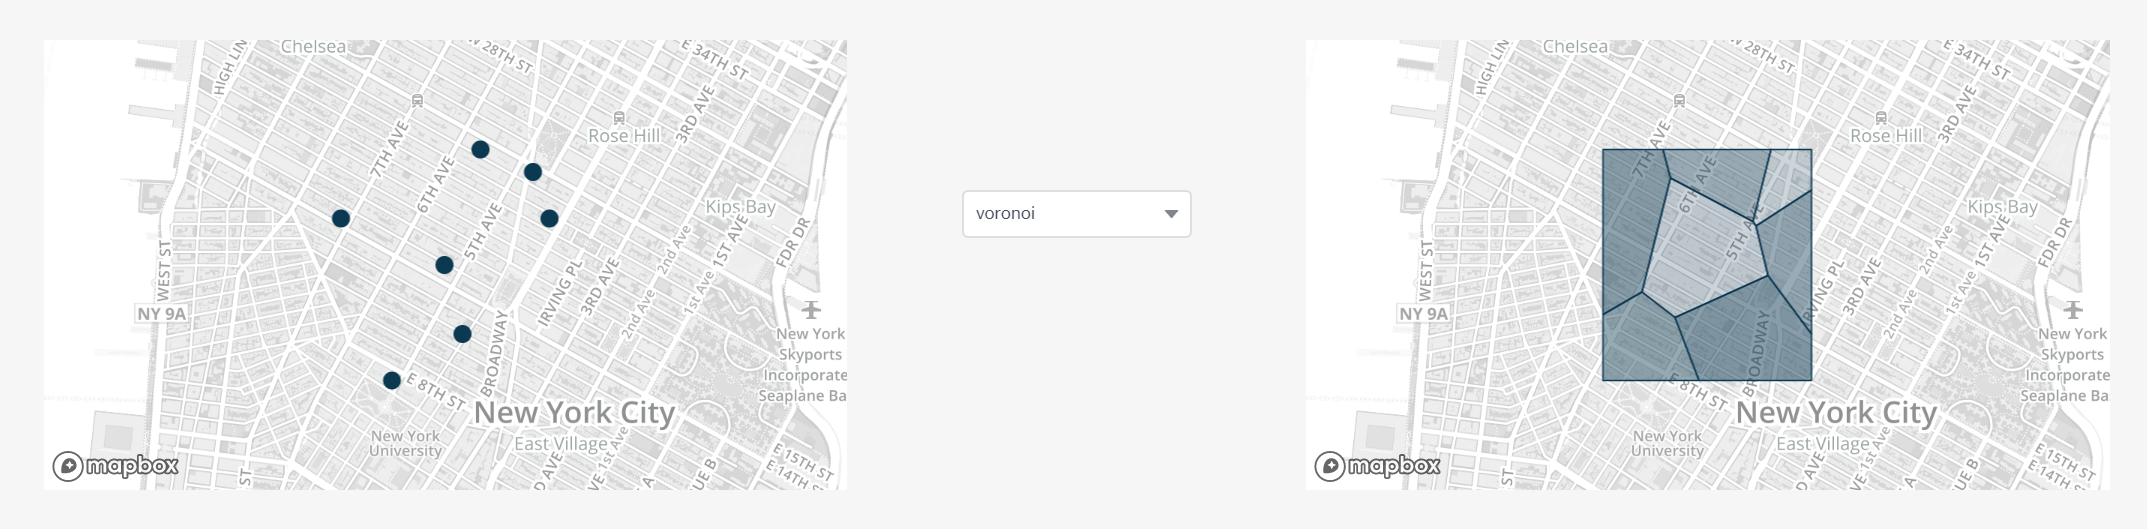 Source: Turfjs.org
Client Side Libraries
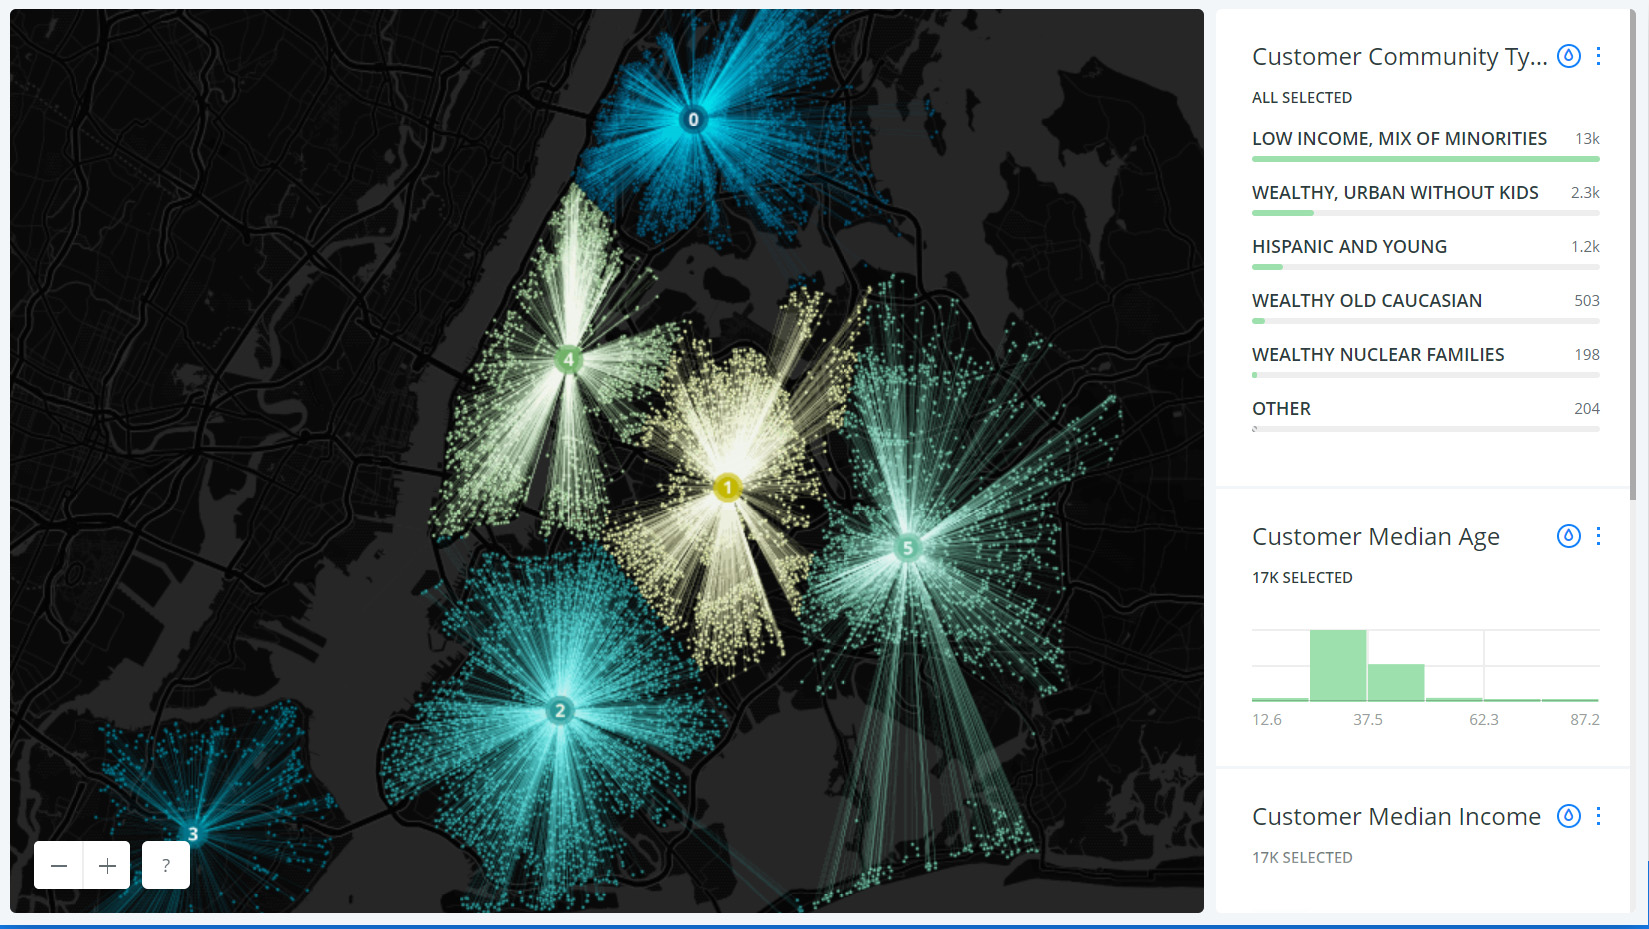
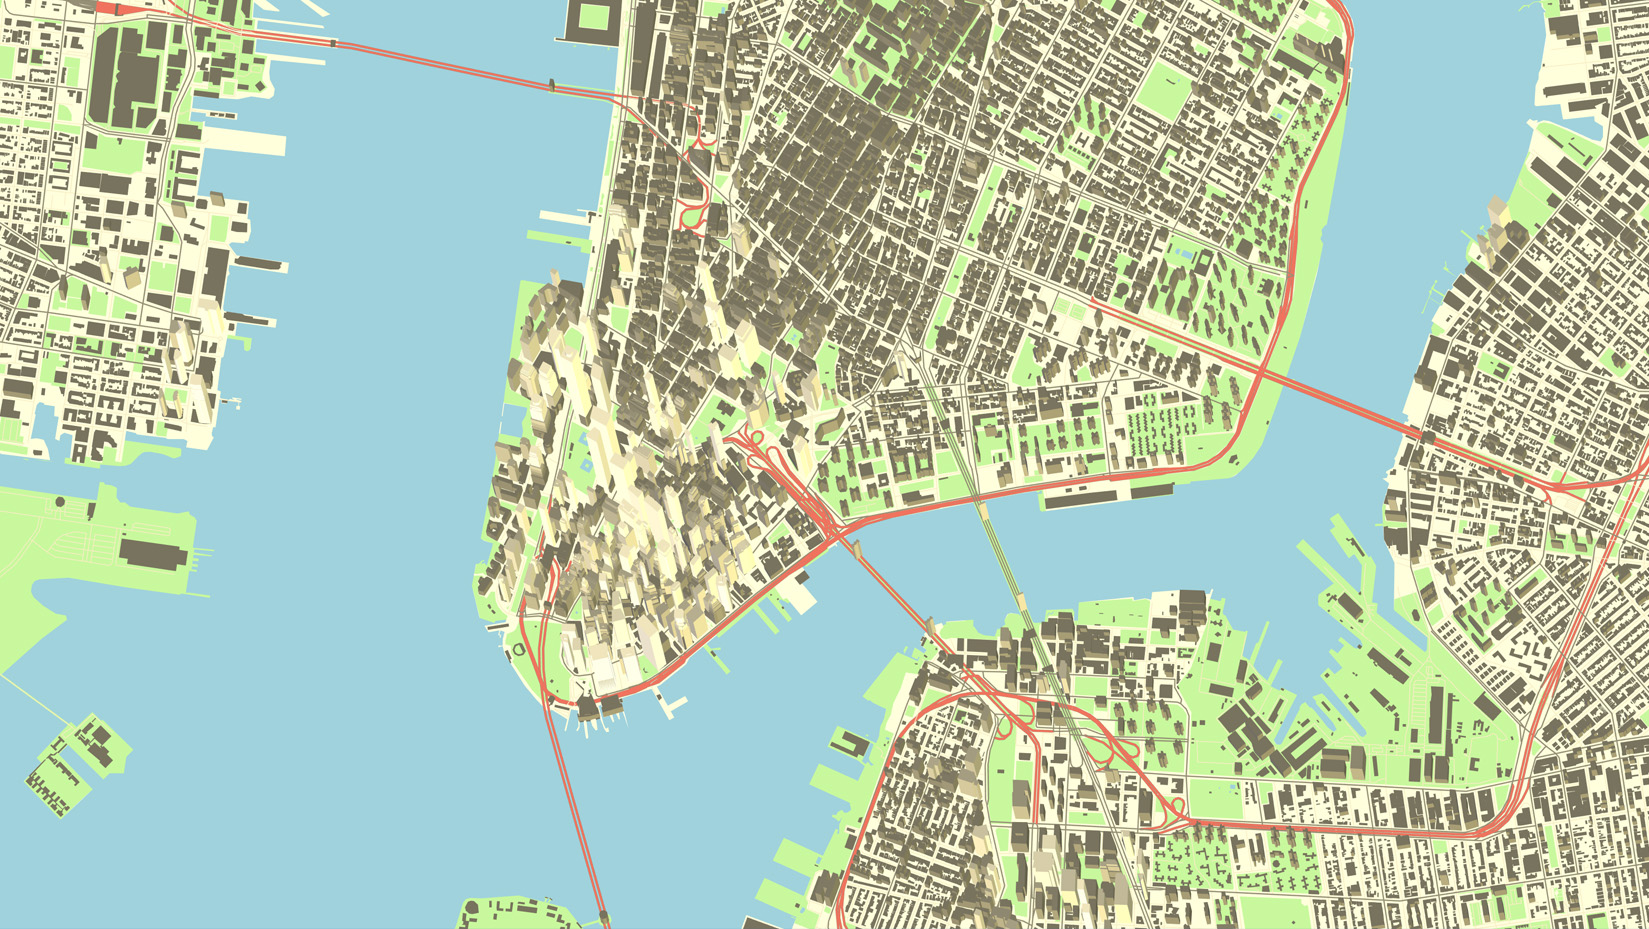
Mapbox is world-class JavaScript library that provides various tools to build cross-platform geospatial apps. It is an excellent library for data-visualization. The browser library, Mapbox GL JS API is open-source and free to use. It also provides support for 3D extrusion of features. See the list of available plugins here.
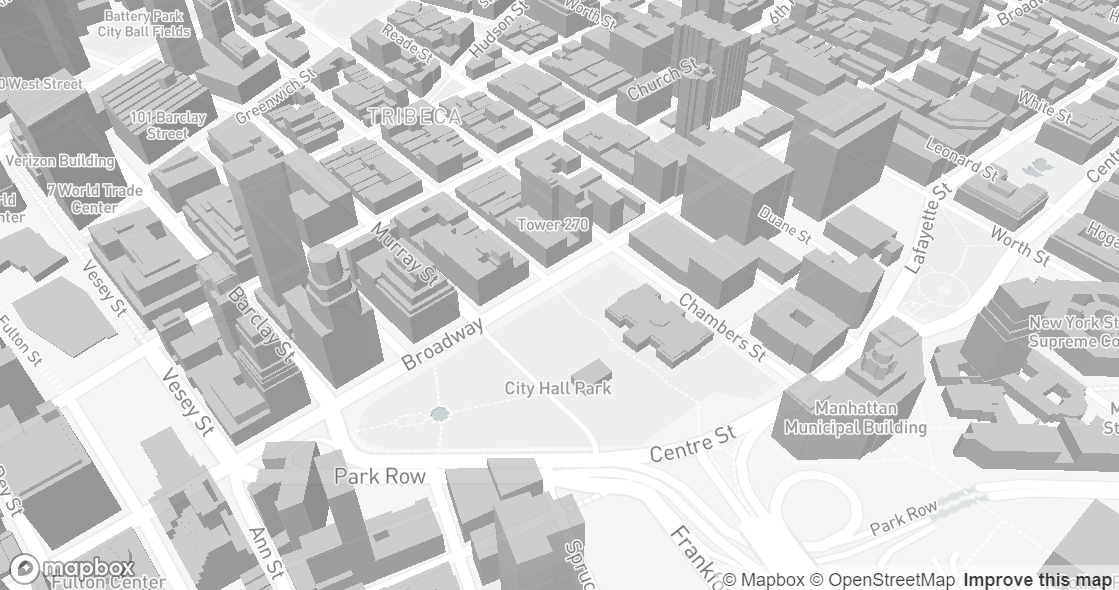 Source: Mapbox - Display buildings in 3D
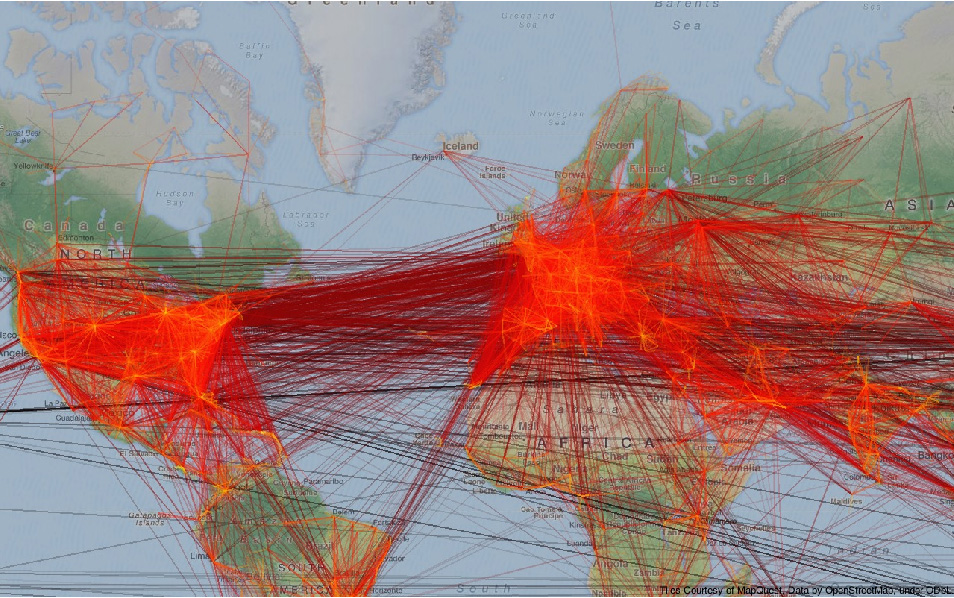
Deck.gl is a large scale Web-GL powered library for data visualization. It is built on Mapbox-gl which also serves as a base map
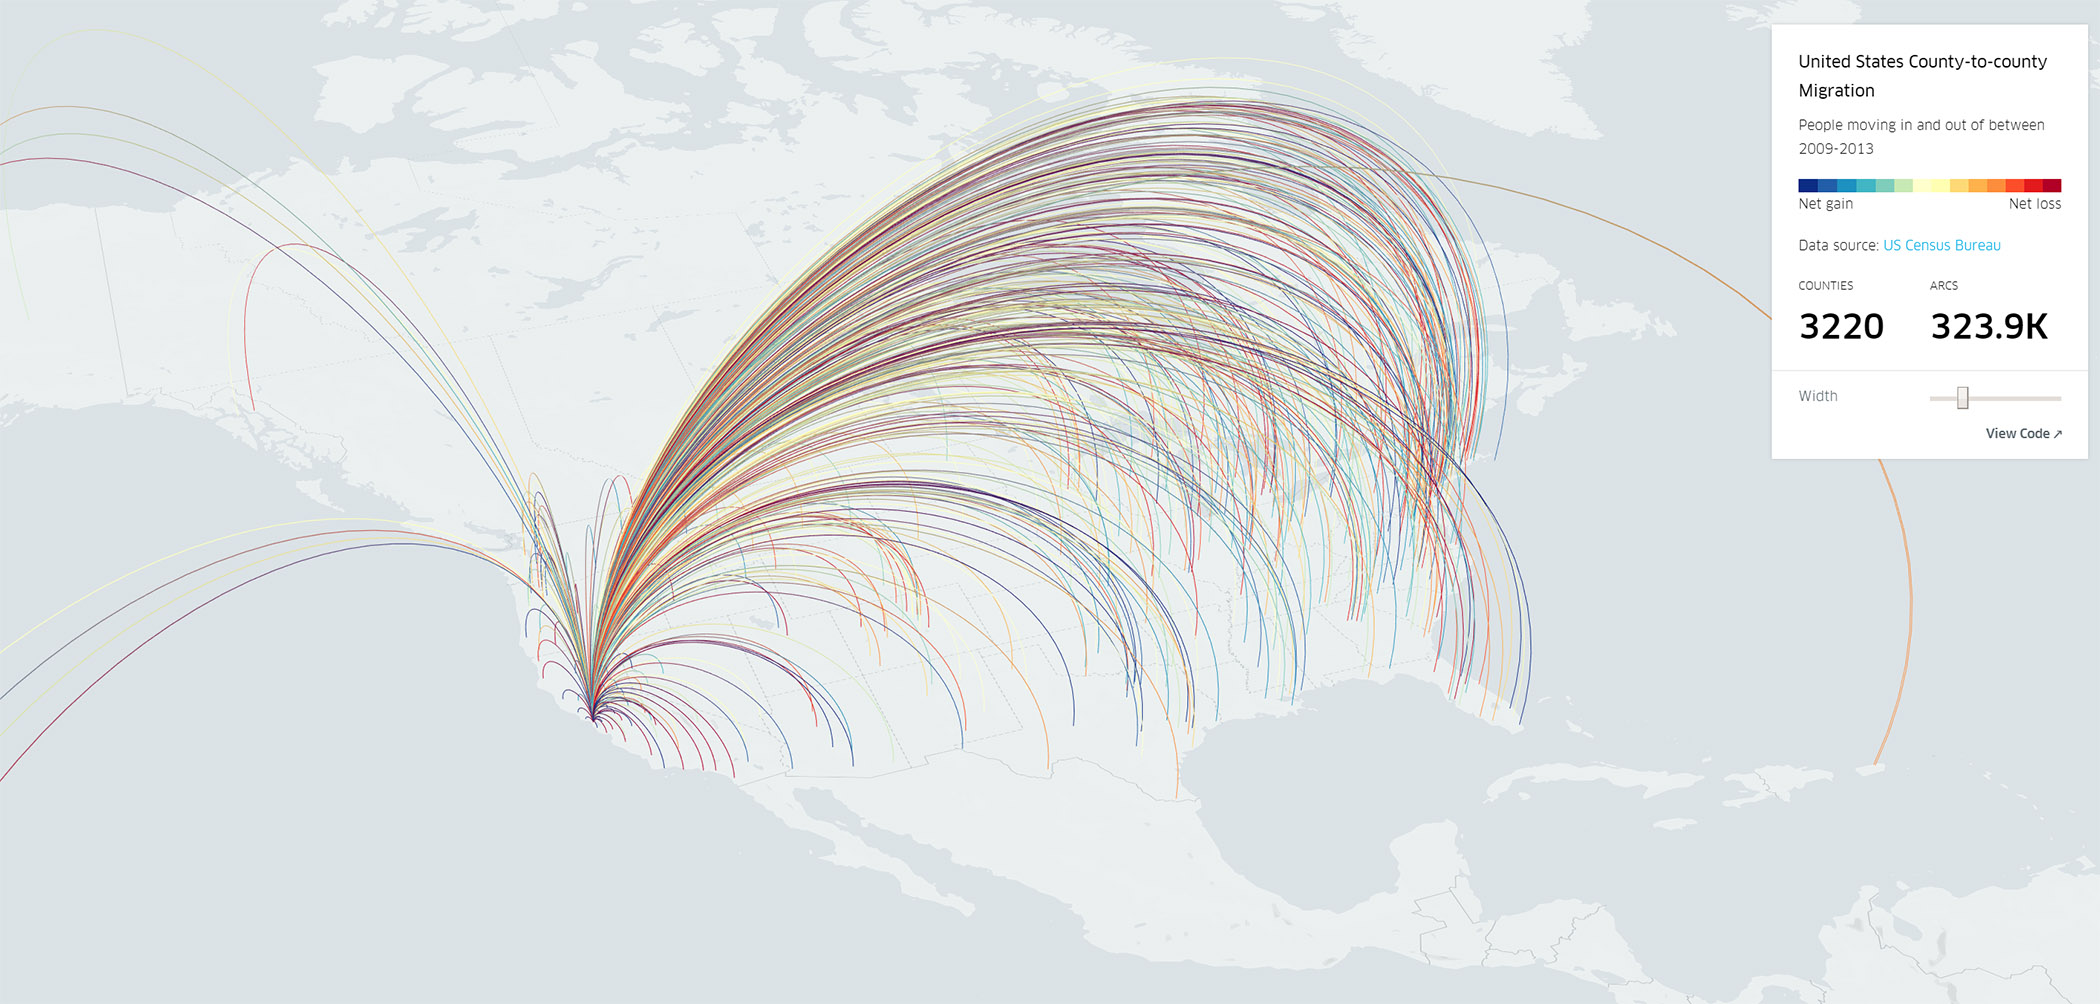 Source: Deck.gl Arc Layer Example
Carto: CARTO.js is a simple unified JavaScript library that interacts with the CARTO Engine service. This library enables you to connect to your stored visualizations, create new visualizations, add custom interaction, and access or query raw data from a web browser.
 Source: carto.com
Mapzen: Mapzen provides host of products and services to render maps on the web. Mapzen's Tangram lets you render 2D and 3D maps while providing granular control over the visual scene.
 Source: Mapzen Tangram
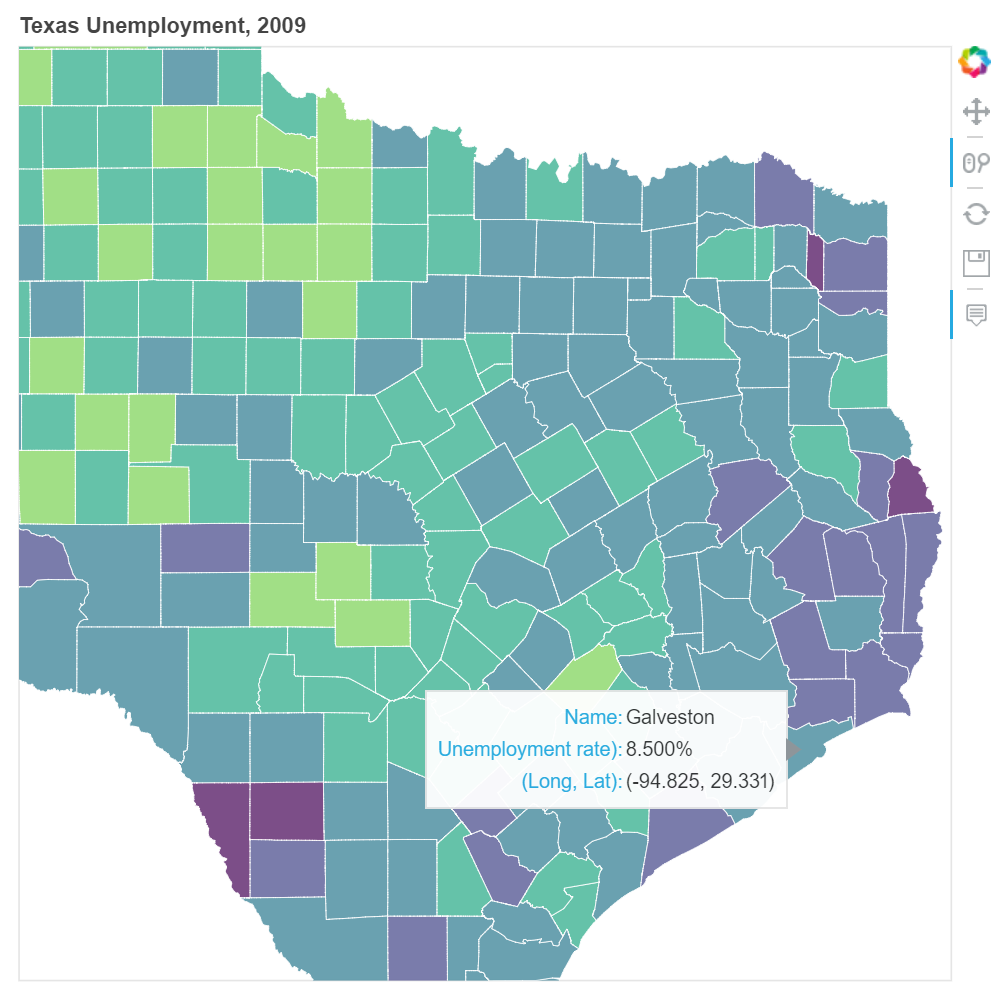
Leaflet an open-source JavaScript library for mobile-friendly interactive maps
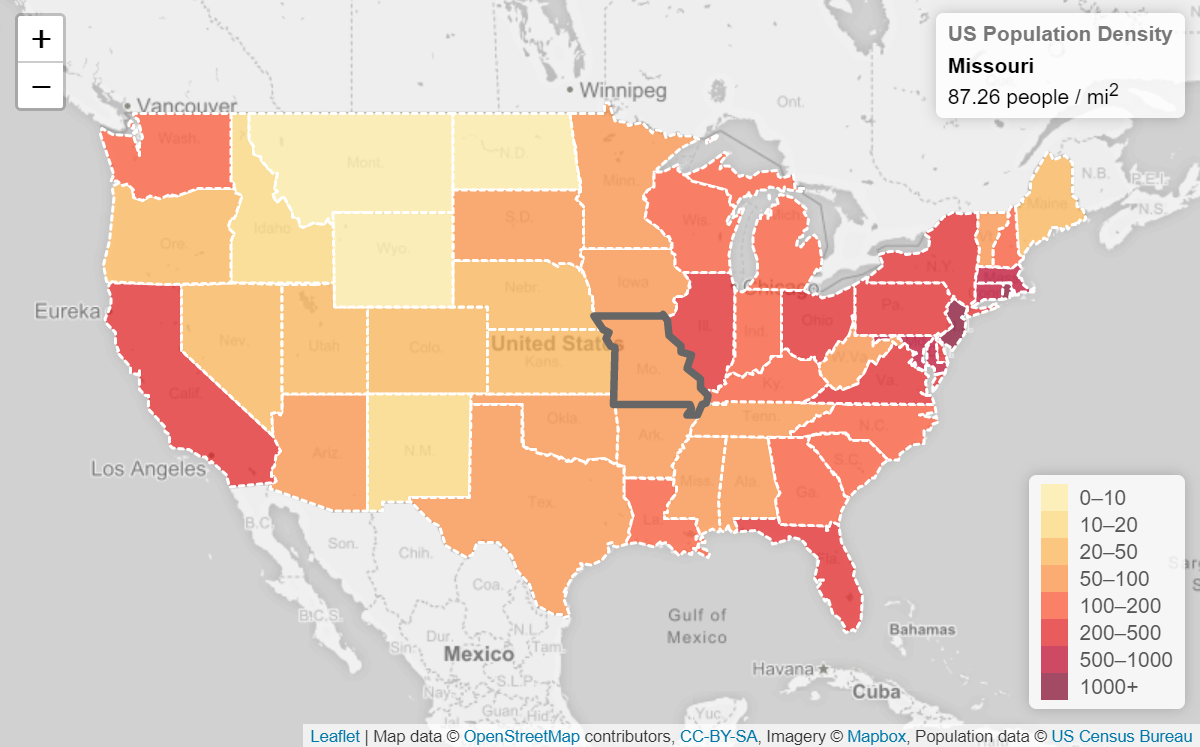 Source: Interactive Choropleth Map in Leaflet
Cesium is an open-source JavaScript library for visualizing 3D globes and maps in the browser. It lets you use 3D tiles to showcase hi-fidelity models of features in the web application. Cesium also supports 3D models.
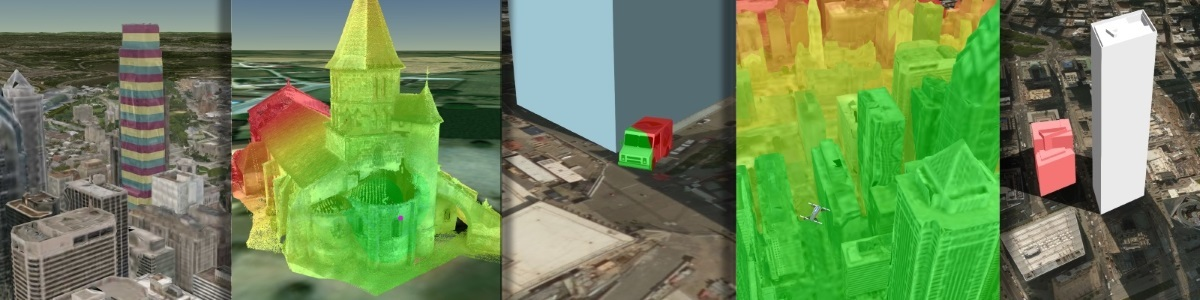 Source: Cesium - The Next Generation of 3D Tiles
D3.js is a JavaScript library for manipulating documents based on data. D3 primarily uses HTML, SVG and CSS to visualize the data via DOM manipulation.
 Source: d3js.org
Three.js is a cross-browser JavaScript library/API used to create and display animated 3D computer graphics in a web browser. It is popular for building experiences for immersive storytelling.
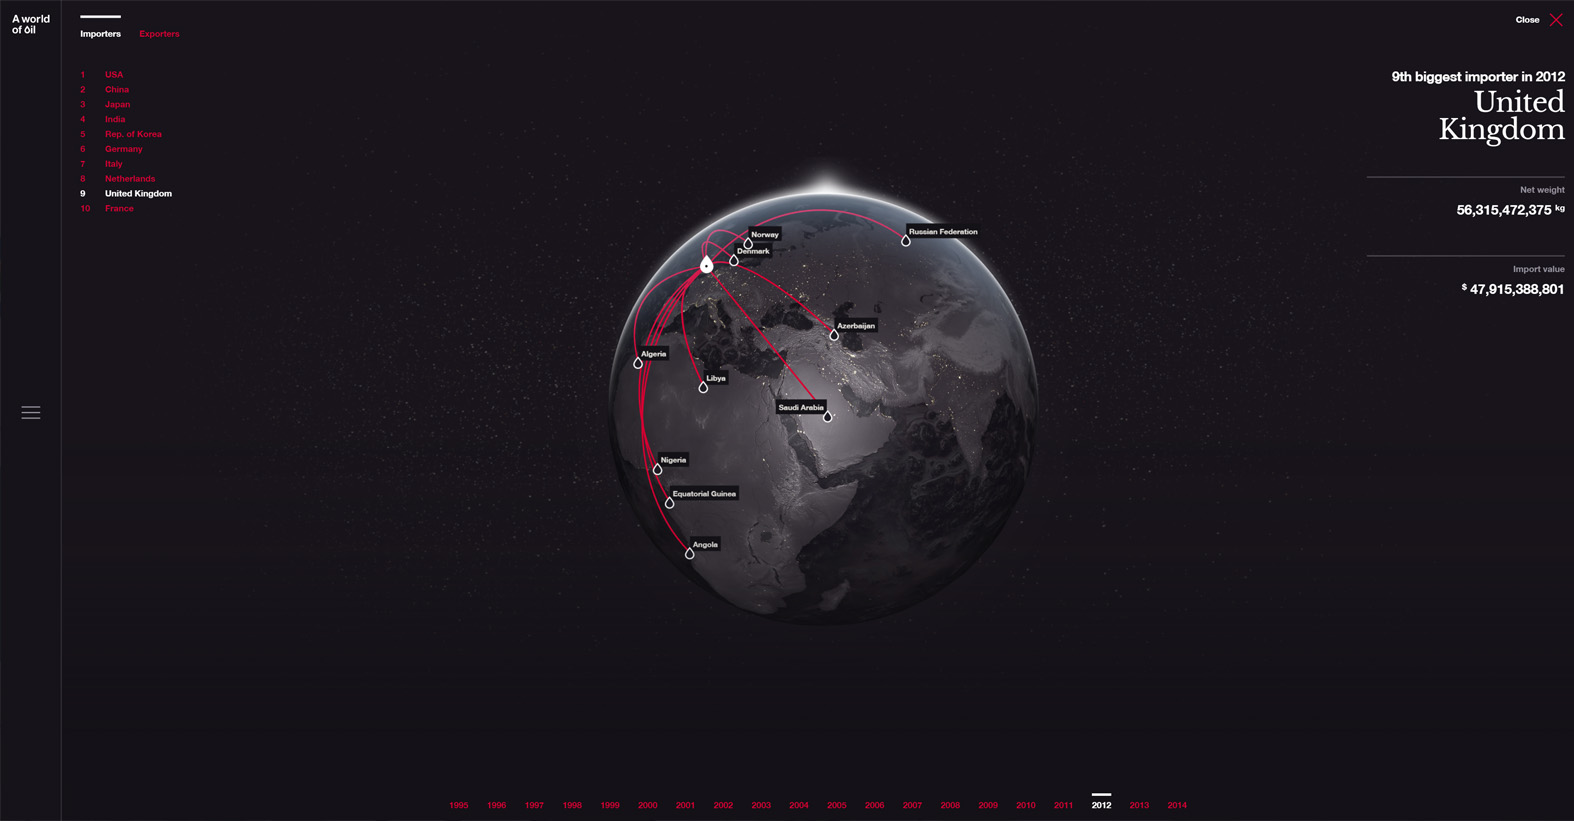 Source: gsmlondon.ac.uk, Global Oil Map
Python
Server Side
- Django is Python framework to build web-applications
Client Side Libraries
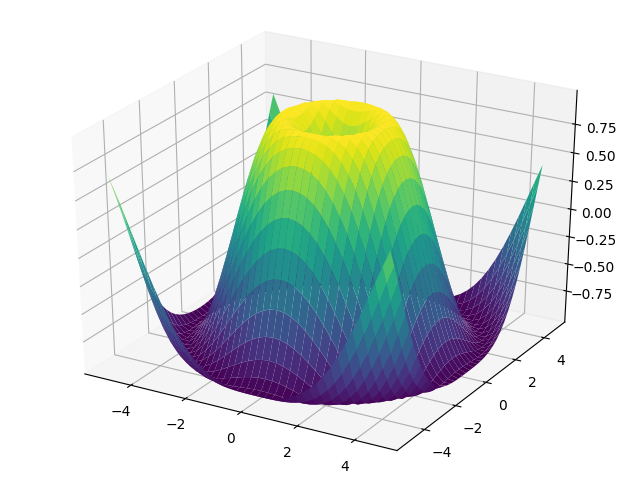
Geoplotlib is a Python library for visualizing geographical data.
 Source: Semantic Scholar
Bokeh is another Python charting library with support for maps.
 Source: bokeh.pydata.org
RasterIO: Geographic information systems use GeoTIFF and other formats to organize and store gridded, or raster, datasets. Rasterio reads and writes these formats and provides a Python API based on N-D arrays.
 Source: A Cloudless Atlas (Wired)
Geotrellis is a geographic data processing engine for high performance applications.GeoTrellis provides data types for working with rasters in the Scala language, as well as fast reading and writing of these data types to disk. It also provides a number of operations to manipulate raster data, including cropping/warping, Map Algebra operations, and rendering operations, as well as vector to raster operations such as Kernel Density and vectorization of raster data.
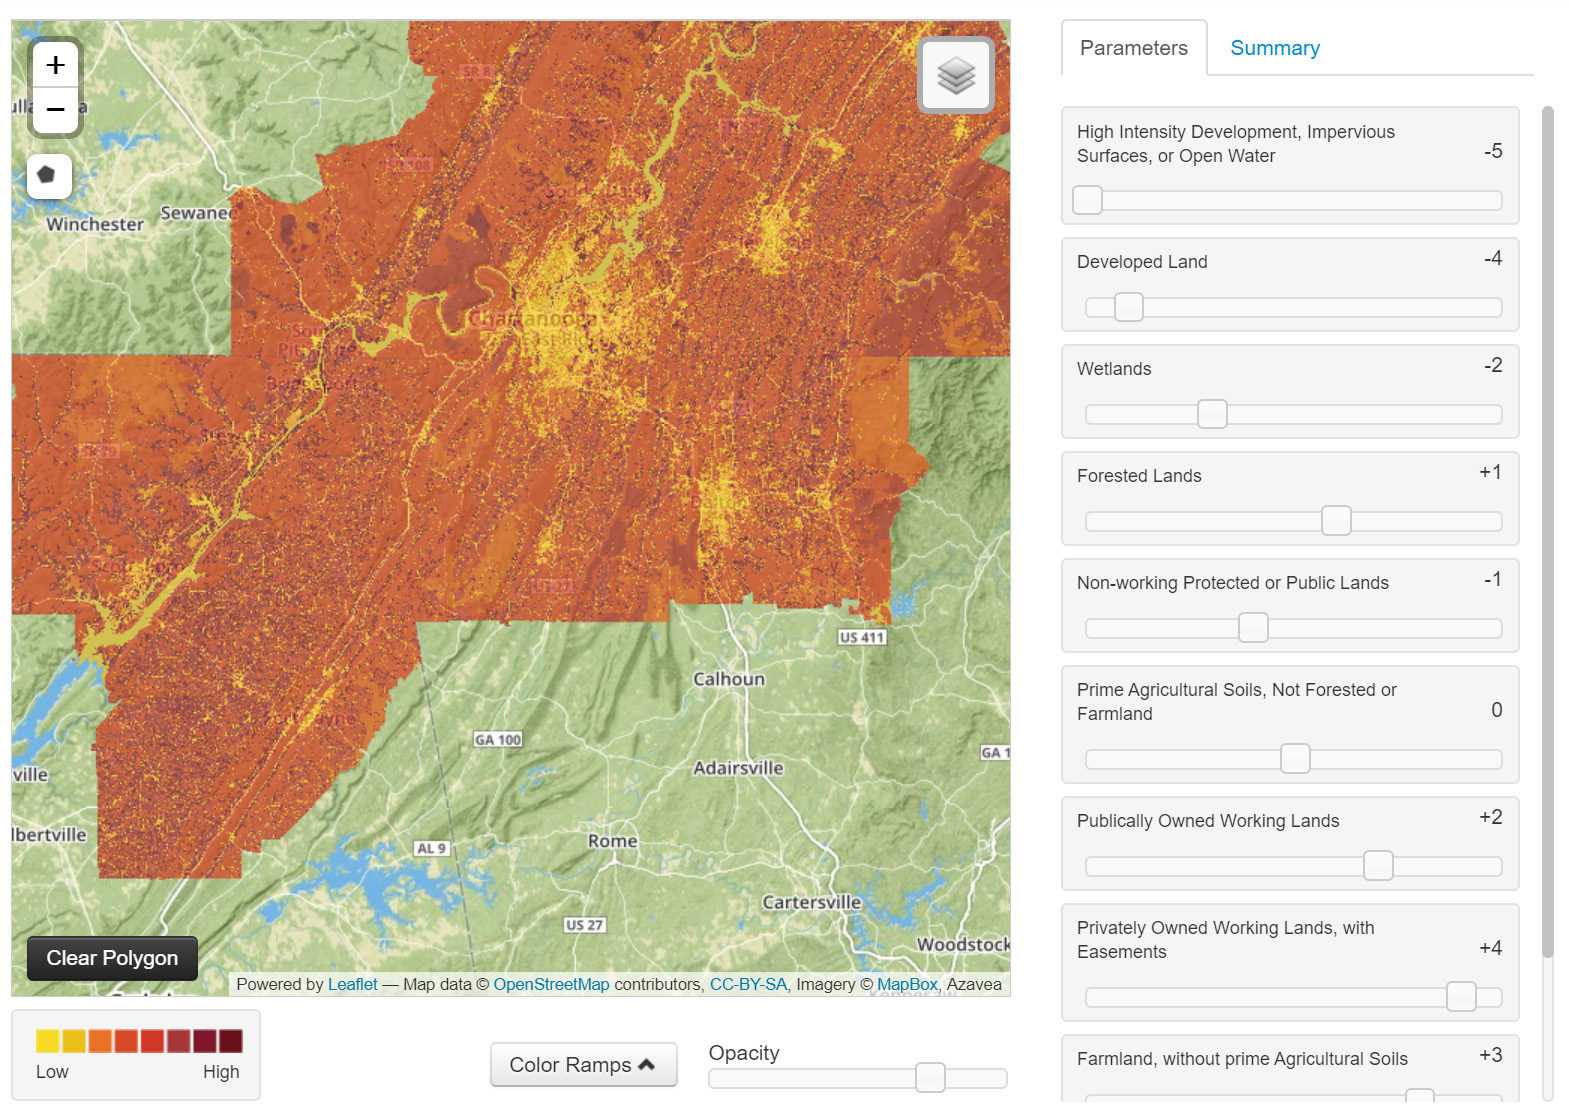 Source: Geotrellis.io Chattanooga Agriculture & Forestry Value Model
Matplotlib is a Python 2D plotting library which produces publication quality figures in a variety of hardcopy formats and interactive environments across platforms. Matplotlib can be used in Python scripts, the Python and IPython shell, the jupyter notebook, web application servers, and four graphical user interface toolkits.
 Source: matplotlib.org
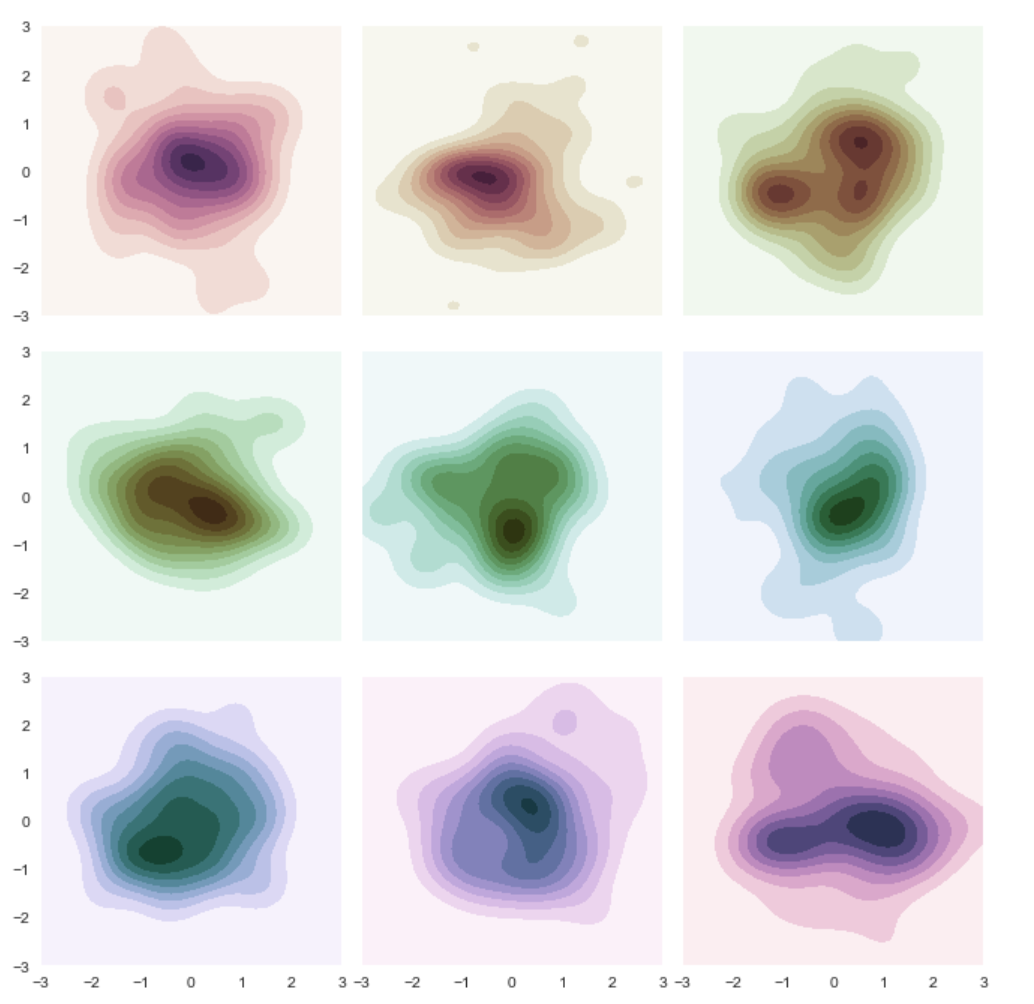
Seaborn is a Python visualization library based on matplotlib. It provides a high-level interface for drawing attractive statistical graphics.
 Source: seaborn.pydata.org
Game Engines
Mapbox SDK for Unity is a collection of tools for building interactive experiences using real maps data.
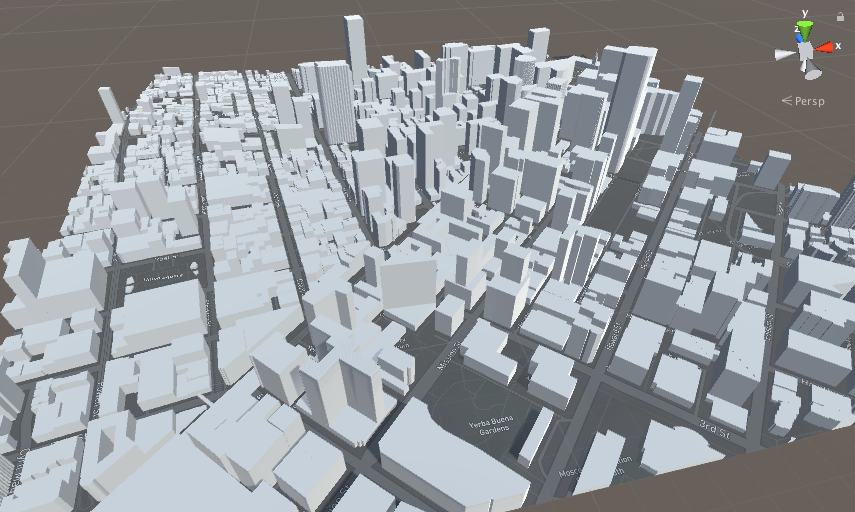 Source: Mesh generation with the Mapbox Maps SDK for Unity
Street Map Plugin for Unreal Engine 4 allows you to import OSM data into Unreal Engine 4 as StreetMap asset type
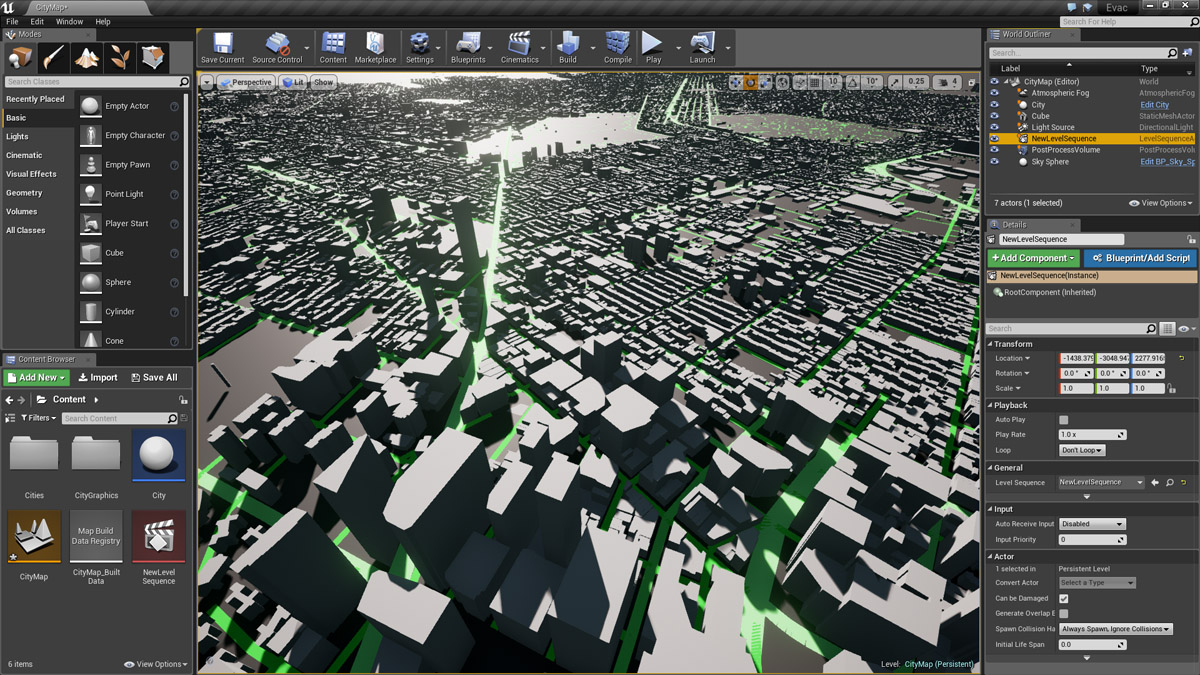 Source: Github, ue4plugins/StreetMap
Additional References
- Combining the Power of AWS Lambda and Rasterio. Processing raster data directly on the cloud. https://blog.mapbox.com/combining-the-power-of-aws-lambda-and-rasterio-8ffd3648c348
- How Web Apps Work, Mapbox. Explanation of how Mapbox GL JS works https://www.mapbox.com/help/how-web-apps-work/
- Python Data Visualization Libraries. Comparing various Python data-visualization libraries. https://www.dataquest.io/blog/python-data-visualization-libraries/
- The Atlas. Charts and data powered by Quartz, https://www.theatlas.com