Web Maps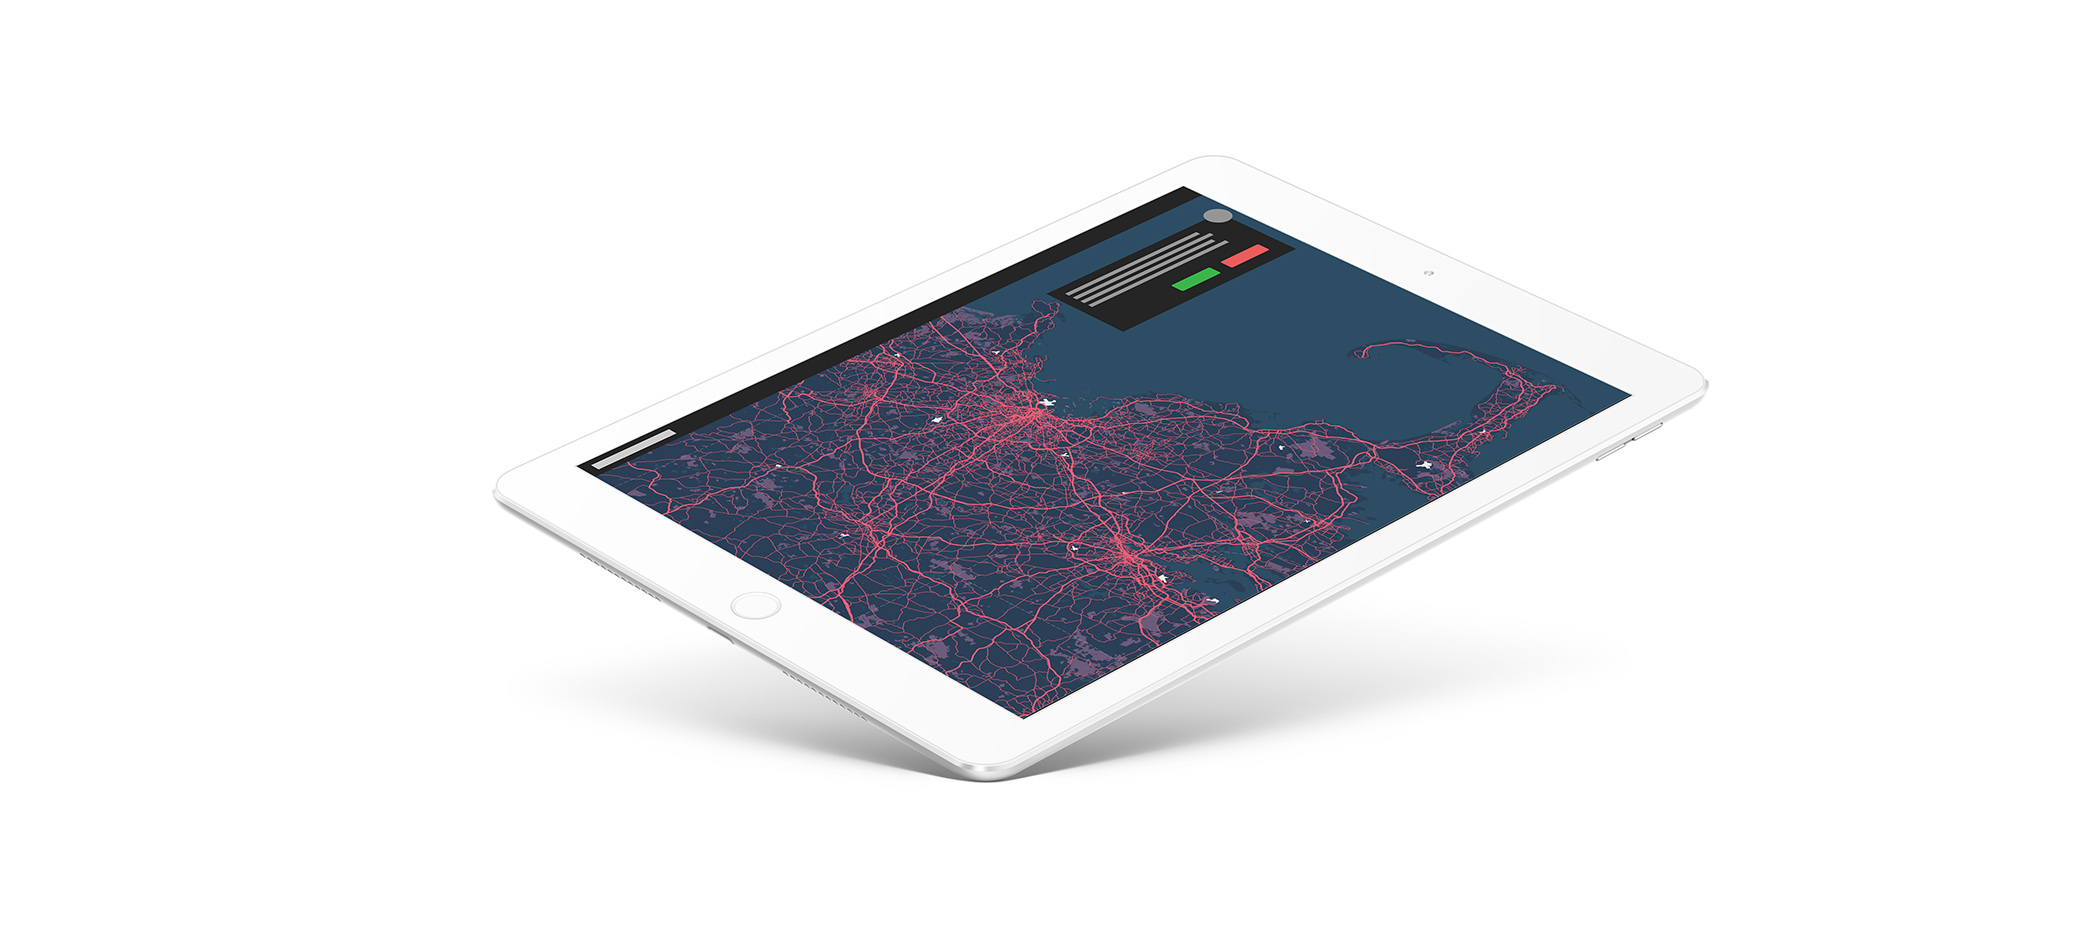
There are mainly two kinds of maps that can be rendered by a web browser—raster and vector. Vector maps are built with vector data tiles, and raster maps are built with raster data tiles. For web maps that viewers can interact with online, tiles are served by a tile server to the client's web browser.
Vector Data
Advantages : Data can be represented at its original resolution and form without generalization. Graphic output is usually more aesthetically pleasing (traditional cartographic representation); Since most data, e.g. hard copy maps, is in vector form no data conversion is required. Accurate geographic location of data is maintained. Allows for efficient encoding of topology, and as a result more efficient operations that require topological information, e.g. proximity, network analysis.
Disadvantages: The location of each vertex needs to be stored explicitly. For effective analysis, vector data must be converted into a topological structure. This is often processing intensive and usually requires extensive data cleaning. As well, topology is static, and any updating or editing of the vector data requires re-building of the topology. Algorithms for manipulative and analysis functions are complex and may be processing intensive. Often, this inherently limits the functionality for large data sets, e.g. a large number of features. Continuous data, such as elevation data, is not effectively represented in vector form. Usually substantial data generalization or interpolation is required for these data layers. Spatial analysis and filtering within polygons is impossible
Raster Data
Advantages : The geographic location of each cell is implied by its position in the cell matrix. Accordingly, other than an origin point, e.g. bottom left corner, no geographic coordinates are stored. Due to the nature of the data storage technique data analysis is usually easy to program and quick to perform. The inherent nature of raster maps, e.g. one attribute maps, is ideally suited for mathematical modeling and quantitative analysis. Discrete data, e.g. forestry stands, is accommodated equally well as continuous data, e.g. elevation data, and facilitates the integrating of the two data types. Grid-cell systems are very compatible with raster-based output devices, e.g. electrostatic plotters, graphic terminals.
Disadvantages: The cell size determines the resolution at which the data is represented.; It is especially difficult to adequately represent linear features depending on the cell resolution. Accordingly, network linkages are difficult to establish. Processing of associated attribute data may be cumbersome if large amounts of data exists. Raster maps inherently reflect only one attribute or characteristic for an area. Since most input data is in vector form, data must undergo vector-to-raster conversion. Besides increased processing requirements this may introduce data integrity concerns due to generalization and choice of inappropriate cell size. Most output maps from grid-cell systems do not conform to high-quality cartographic needs.
Source: Answer by Mapperz gis.stackexchange.com:
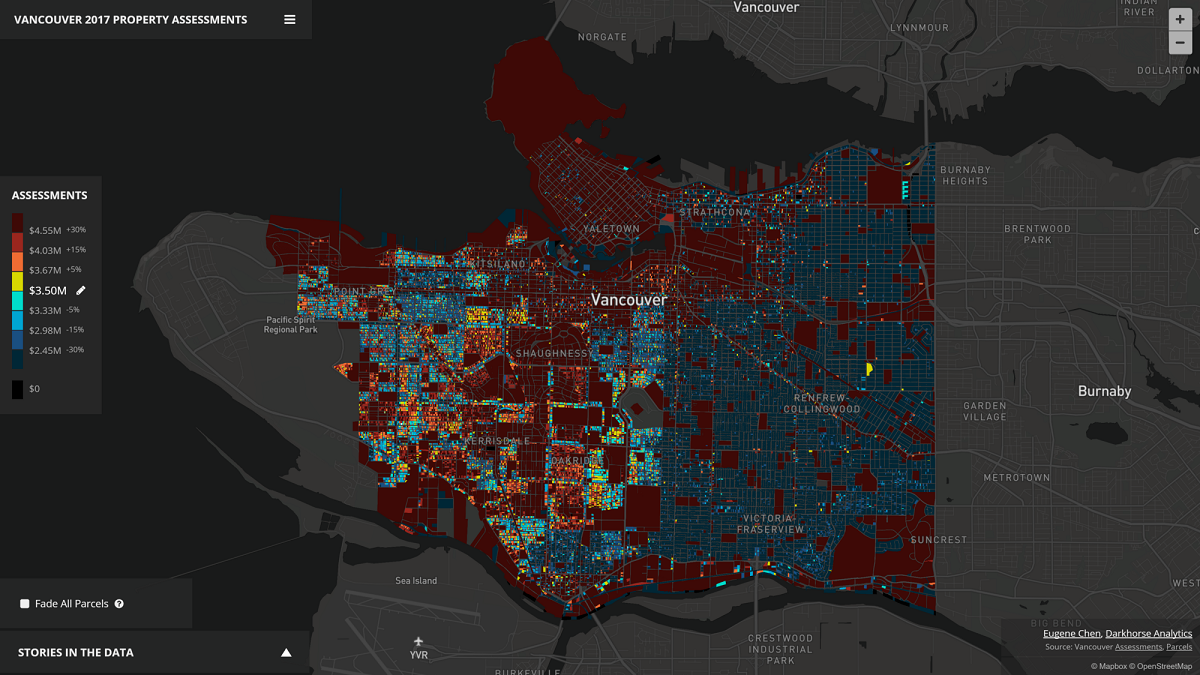 Example of a Vector Map. Source: Hundreds of thousands of polygons rendered on the fly, Points of Interest, Mapbox
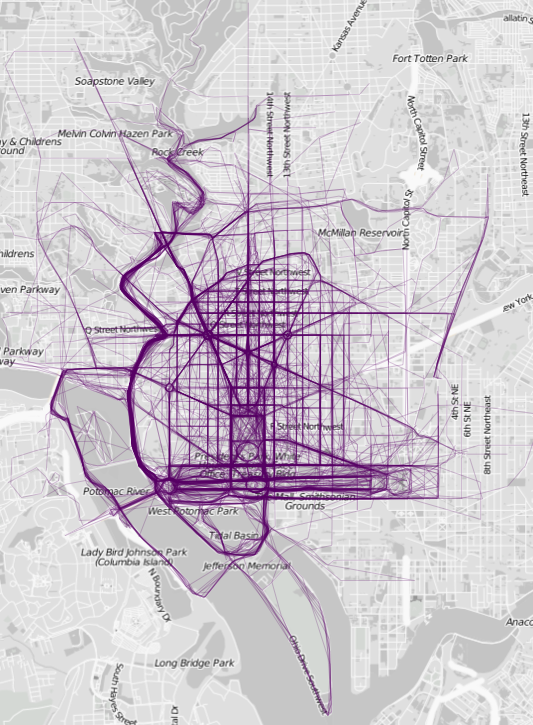
Example of a Raster Map. Source: City Lab. Where People Run
Additional References
- Damon Burgett. Animated Atmospheric Water. Animated weather data unearths complex and beautiful patterns in our atmosphere. https://blog.mapbox.com/animated-atmospheric-water-bc475aac1eaa
- Andrey Kramatsky. 3D agglomerations: How I built it. Visualizing macro-urban trends in cities across the world. https://blog.mapbox.com/how-i-built-it-3d-agglomerations-64b42464d785
- Damon Burgett. Creating Vector Maps From Raster Data. Vectorizing data for creating dynamic visualizations. https://blog.mapbox.com/creating-vector-tiles-from-raster-datasets-f8c9dc652c97